The Oval
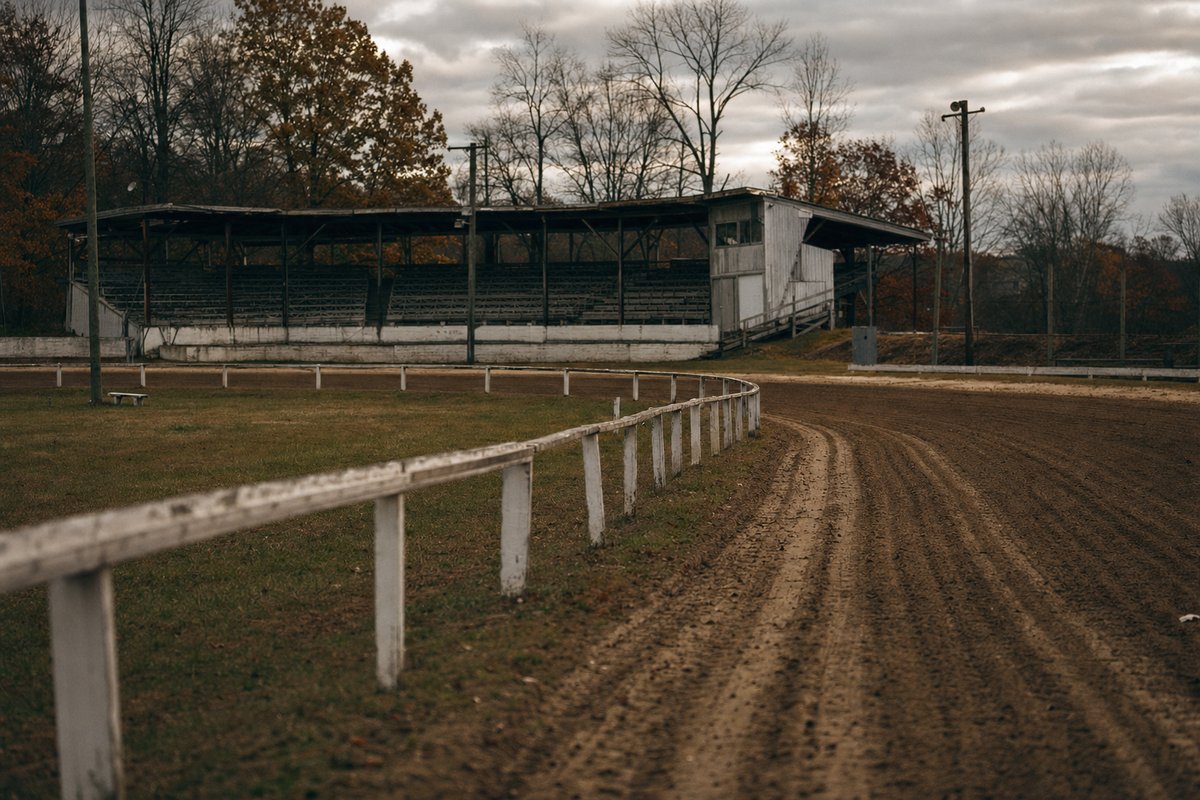
Plainridge Racecourse harness racing ran at Plainville in southeastern Massachusetts, close to the Rhode Island border. It raced standardbreds, pacers and trotters in harness behind a sulky, on a five-eighths-mile oval, which places the track squarely between the tight half-mile bullrings of the fair circuit and the big mile ovals of the major betting meetings.
That measurement is the most useful fact about the place, and it shapes every set of Plainridge Racecourse results. A mile on five-eighths turns four times instead of twice, and each of those turns costs momentum. It rewards a driver who can hold position and punishes an outside draw heavily.
What the Draw Was Actually Worth
That claim is testable, and the record here tests it. Across 3,455 charted starts where the judges recorded both a numbered draw and a finishing position, the inside posts win several times as often as the outside ones, and the gap only widens the further out a horse begins from the pylons.
The registered standard for the sport in the United States is kept by the United States Trotting Association, which licenses the drivers and trainers named in these charts and holds the studbook the pedigree lines come from. Racing at Plainville today falls under the Massachusetts Gaming Commission, which took over oversight of the meeting after the 2011 expanded-gaming act; the charts on this site all predate that change.
Source: 3,455 charted starts recording both a numbered draw and a finishing position, Plainridge Racecourse programmes 2000–2014 · prcharness.com
Read the pale columns rather than the solid ones for the clearest version of it: the top-three rate falls away from 41.8% off post one to 13.7% off post 9. On a mile oval that spread would be far narrower, because a horse would negotiate two turns rather than four.
For the same reason its times read slower than the marks quoted from Lexington or the Meadowlands. That is geometry rather than quality, and the gap is measured in lengths rather than in class. Comparing a Plainridge mile with a mile-track mile without accounting for the extra turns is the most common error made about small ovals.
The Plainridge Racecourse Oval at Plainville
Plainridge Racecourse harness racing was a regional meeting rather than a stakes track. A race carried an average purse of about $3,107, with the largest recorded here being $50,000. Cards were assembled week by week from condition and claiming races, at Plainville, out of whatever the local colony could fill.
The racing office did that assembling with class codes, and the number of distinct codes is what stands out. The glossary holds every condition carded in these programs, and the sheer count of them is far more variety than an outsider would ever expect from a meeting of this size and purse level.
Harness Racing Class Structure and Purses
A track this size draws a stable colony rather than a rotating cast. The same drivers and trainers appear season after season, very often filling both roles behind the same horse, which means reading form here is a matter of reading it against one oval rather than against a national circuit.
| Driver | Drives | Wins | Win % | Seasons |
|---|---|---|---|---|
| Brad D Irvine | 218 | 35 | 16.1 | 2002–2005 |
| Winston D Campbell | 206 | 32 | 15.5 | 2001–2005 |
| Greg D Bowden | 225 | 28 | 12.4 | 2001–2005 |
| James E Hardy | 221 | 22 | 10 | 2001–2005 |
| Gregory J Annaloro | 114 | 18 | 15.8 | 2002–2004 |
| Michael E Eaton | 194 | 17 | 8.8 | 2001–2005 |
| Ronald L Cushing | 94 | 16 | 17 | 2004–2005 |
| Robert W Sumner | 124 | 14 | 11.3 | 2002–2005 |
These figures count only the charted starts held in this archive, so they are a sample of each career rather than a complete tally. They understate a genuinely long career quite badly. Where the track's own published standings survive, those appear on the individual driver and trainer pages beside them.
What the Results Record Holds
The Plainridge Racecourse results here run from 2000 to 2014 across 241 separate race days. It is a substantial sample rather than a complete run: some seasons are well represented and others thin, and every page states plainly whether it holds the official chart, the entry sheet printed beforehand, or both of those documents together.
Payout figures are the biggest gap. Win, place and show prices were printed on a separate sheet that carried no year, so the only ones shown are those that could be tied to a card by matching the horses themselves against the field. The wager types page sets out what did survive.
The Shape of a Harness Racing Season at Plainville
The meeting did not run at one steady rate. 241 race days survive across 14 seasons, and they are weighted heavily towards the middle of that span: the 2003 season alone accounts for 57 of them, while three of the other seasons contribute fewer than ten surviving days each between them.
A surviving card carries a median of 10 races, which is the ordinary length of a regional programme anywhere. That figure barely moves across the whole record, so the meeting's expansion and contraction shows up in the number of days it raced rather than in how much racing each day held.
Two seasons are absent from the charted record entirely. Nothing comes through for 2006 or for 2012, and both of those gaps sit inside years in which the meeting demonstrably ran, which makes each of them a failure of the paperwork to survive rather than any interruption to the racing itself.
Read against the calendar, that distribution is the single most useful caution about everything else set out on this page. A figure drawn from 1990 races is not a figure drawn evenly across fifteen years, and any season-to-season comparison made here has to account for how unevenly the surviving evidence is actually spread.
Gaits, Fields and the Harness Racing Card
The card was overwhelmingly a pacing one. 1534 of the surviving races were for pacers against 437 for trotters, close to four to one, and that ratio holds steady enough across all of the seasons to be treated as the settled character of the meeting rather than a passing preference in one of them.
Fields were full. Where a chart records a complete finishing order the median race went to the gate with 8 starters, and the range across the whole record runs from six to ten. A regional meeting that consistently fills eight-horse fields is one with a real local colony standing behind it.
Every race in the record was contested at one mile. The distance never varies once across the whole record, which is worth stating plainly because it makes the winning times on this page directly comparable with one another even where the class, the season and the track surface underneath them all differ considerably.
376 entries were scratched from races whose charts survive. A scratch leaves its row standing in the chart with the position replaced by a marker rather than being deleted outright, which is why a field of nine on the entry sheet can finish as a field of eight with no apparent explanation anywhere.
The Clock and the Surface Underneath It
Across 1095 fully charted races the winning mile ran from 1:52.3 at the quickest to 2:05.3 at the slowest, with the median sitting at 1:58.0. That spread is the honest working range of a five-eighths-mile oval carrying a card made up mostly of conditioned races rather than a stakes programme.
The final quarter is the more revealing figure of the two. It ranges from 27.3 seconds to 33.1 across those same races, at a median of 30.1, and it is the number that separates a race won on a fast early pace from one won by a horse still finishing when the others had stopped.
The surface was fast on 89 per cent of the days that record a track condition at all. The remainder split between good, sloppy and slow going, and any time that was set on one of those days should be read against its own condition rather than against the median figure given above.
Those two facts together are why a single mile time means very little in isolation. A 1:58.0 mile on a sloppy track in a low conditioned class is a different performance from the same time on a fast surface in an open event, and the chart gives you both halves of that comparison.
What the Betting Public Got Right
The charts record a closing price for 3089 individual starters. The median is 8.1 to one and the longest price recorded anywhere in the whole of the record is 231.9 to one, which is the sort of number that a small field in a wide-open conditioned race will occasionally produce.
A favourite is marked in 393 of the charted races. It won 138 of them, or 35 per cent, at a median closing price of about even money. That strike rate sits close to what a pari-mutuel market usually returns, which is a quiet argument that the betting on this meeting was competently priced.
The gap between those two figures is the whole point of a pool. The median starter went off at 8.1 to one because most starters do not win; the favourite went off near even money because it wins about a third of the time. Neither of those numbers is a prediction.
The Colony Behind the Meeting
175 drivers appear in the surviving charts, and the work was concentrated among them: the five busiest between them took 30 per cent of all 3574 charted drives. A regional meeting runs on a nucleus of full-time horsemen with a long tail of names appearing once or twice behind them.
The racing office ranked them itself. 297 leading-driver and leading-trainer table entries survive, attached to the individual driver and trainer records rather than kept as a separate list, and they are the only ranking in this archive that the meeting made of itself rather than one counted afterwards from the charts.
The same names recur on both sides of the programme, because the trainer who also takes the lines is the ordinary arrangement at this level. Reading a driver record here therefore means reading it against one oval and one colony rather than against the much wider spread of a national circuit.
The Class Ladder the Racing Office Actually Used
The card was built from conditions rather than from grades. 258 distinct class codes appear on the surviving programmes and 164 of them are decoded on this site, 104 of which set their eligibility in money already won rather than in races won or in the age of the horse.
The commonest condition by a wide margin is a non-winners-of-a-sum-per-start race, which appears on these cards more often than any other single code does. A ladder built that way sorts a colony continuously and without argument: a horse that wins climbs out of its own condition automatically and then has to find the next one up.
Ahead of each programme the office published what it intended to offer. 169 condition sheets survive carrying 1419 advertised events, and 175 of those events carry an also-eligible line, which is the racing office keeping a looser second route into the race open in case the primary condition drew too few horses.
Comparing the sheets against the cards is the most direct measure available of how hard the meeting was to fill. An event advertised on a sheet that never appears on a programme simply failed to attract entries, and the sheets are the only surviving record that it was ever offered at all.
The Other Business on the Same Floor
Live racing was never the whole of the operation on the grounds. 370 daily simulcast menus survive, naming 833 distinct tracks between them and adding up to 13,772 individual track-days of imported racing that was bought in and then sold on the betting floor across 9 separate years of this record.
That is a great deal more racing than the meeting itself ever staged. The live card filled a few hours on a few dozen afternoons a year, while the simulcast menu filled in the whole of the rest of the calendar, and it mixed harness racing with thoroughbred flat cards and greyhound racing without any distinction at all.
The difference matters for reading this archive. A wager struck on the floor at Plainville was often settled into the pool of a track hundreds of miles away, and only the live cards indexed here produced the charts, the entries and the winning times out of which the rest of this record is built.
Qualifiers, Standings and the Paperwork Around the Racing
Not every race on the grounds carried money. 35 qualifier dates survive with 78 races between them across the 26 cards that kept their race detail, and a qualifier exists to prove a horse fit to compete rather than to settle a bet, so it carries no purse and no betting.
The record also holds what the office published about itself. 297 leading-driver and leading-trainer table entries survive, along with 61 divisional track records covering 54 different horses between them, which together are the only rankings anywhere here that the meeting itself made rather than ones counted afterwards from the charts.
The document types are worth keeping separate. An entry sheet states who was drawn in; a chart states what actually happened; a payout sheet states what the pools returned. 1445 races in this record hold both an entry sheet and a chart, and most of them hold only one or the other.
That unevenness is the honest shape of a recovered archive rather than a defect in it. Where only the entry sheet survives the field is known and the result is not; where only the chart survives the reverse is true, and every page here states which of the two it is working from.
What the Money Evidence Does and Does Not Cover
The wagering side of this record is much thinner than the racing side is. 18 of the 241 race days here carry payout figures at all, holding 574 exotic payout lines between them, so for the great majority of afternoons the result survives and what the pools returned does not.
That imbalance is worth stating rather than smoothing over. A page that shows a chart without a payout is not incomplete through carelessness: the mutuel sheet for that day simply did not come through, and inventing a figure to fill the column would corrupt the only reliable part of the record.
The horse population shows exactly the same shape from the other direction. 2,864 names appear somewhere in the surviving programmes and 1,124 of them carry enough charted racing to justify a record page, which leaves well over half of the names known only from a single appearance on one card.
Questions About the Racecourse
Where is Plainridge Racecourse?
In Plainville, Massachusetts, in the southeastern corner of the state near the Rhode Island line. Its location put the track within reach of both the Boston and Providence markets, which mattered for a standardbred meeting competing against the bigger tracks in New York and New Jersey.
How big is the track?
It is a five-eighths-mile oval. That is between the half-mile bullrings common at small meetings and the mile ovals of the major tracks, and it means a mile race has to turn four times rather than twice. That geometry shapes both the racing itself and every time recorded on it.
What kind of racing was held there?
Standardbred harness racing, both pacing and trotting. In the programs held here 1534 races were pacing and 437 were trotting, which reflects the usual balance right across North America, where the pace has long been the more common of the two gaits by a very wide margin indeed.
What class of racing was it?
Regional rather than stakes-level for the most part. Purses across the surviving cards averaged about $3,107 a race, with the largest recorded here at $50,000. The card was built week to week from condition and claiming races rather than from graded or stakes events, which is the ordinary pattern for a meeting of this size.
What is the fastest mile recorded at the track?
Among the divisional track records held here, the quickest is 1:49.2 by MALTESE ARTIST, driven by B. Rangerl. Because the oval is five-eighths of a mile, that time is not directly comparable with marks set on a mile track.
Does the track still operate?
Live harness racing still takes place at Plainville under the site's present operator, on a spring-to-autumn schedule. This archive covers the earlier racecourse era rather than the current meeting, so what is held here is a historical record rather than any kind of guide to today's racing, entries or post times.
Who kept the standings?
The racing office published leading-driver and leading-trainer tables during the meeting. Standings survive here for 1999, 2000, 2001, 2002, 2003, 2004, and they are attached to the individual driver and trainer records rather than kept as a separate list.
How much of the racecourse record survives?
Programs for 241 race days across 14 seasons, covering 1990 races. That is a substantial sample of a long meeting rather than anything like a complete run, and every page states plainly whether it holds the official chart, the entry sheet, or both of them together.
How many race days does the archive hold?
Programs for 241 race days across 14 seasons, holding 1990 races between them. The days are not spread evenly: 2003 alone accounts for 57 of them, and nothing at all survives for 2006 or 2012 even though the meeting ran in both.
How long was a card at Plainridge?
A median of 10 races. That figure holds steady across the whole record, so the meeting grew and shrank by racing more or fewer days rather than by lengthening or shortening the individual programme.
How big were the fields?
Where a chart records a full finishing order the median race went with 8 starters, and the range runs from six to ten. A regional meeting filling eight-horse fields consistently is one with a real local colony behind it.
How fast was a winning mile here?
Across 1095 fully charted races the winning mile ran from 1:52.3 at the quickest to 2:05.3 at the slowest, median 1:58.0. Every race in the record was at one mile, so those times are directly comparable with one another.
What was the track surface usually like?
Fast on 89 per cent of the days that record a condition at all. The rest split between good, sloppy and slow going, and a time set on one of those should be read against its own condition rather than the median.
What did races pay?
Purses ran from $2,500 at the median up to $50,000 at the top, and only 24 races in the whole record carried $10,000 or more. This was a conditioned card with occasional stakes money rather than a stakes meeting.
Did the betting favourite usually win?
A favourite is marked in 393 charted races and won 138 of them, or 35 per cent, at a median closing price near even money. The median starter, by contrast, went off at 8.1 to one.
How many drivers rode the meeting?
175 appear in the surviving charts, and the work was concentrated: the five busiest took 30 per cent of all 3574 charted drives between them. The trainer who also takes the lines is the ordinary arrangement at this level.
Was the track only about its own racing?
No. 370 daily simulcast menus survive, naming 833 distinct tracks and 13,772 imported track-days. Far more racing was sold on the betting floor than the meeting itself ever staged, and it mixed harness, thoroughbred and greyhound cards.
How were the races classified?
By written condition rather than by grade. 258 distinct class codes appear on the surviving cards, 164 of them decoded on this site, and 104 of those set eligibility in money already won rather than in races won.
What is a condition sheet?
The sheet the racing office issued before a programme, saying what it intended to offer. 169 survive here carrying 1419 advertised events, 175 of which include an also-eligible line to keep a second route into the race open.
Were there races without betting?
Yes — qualifiers. 35 qualifier dates survive with 78 races between them. A qualifier proves a horse fit to compete rather than settling a bet, so it carries no purse and no wagering.